Analyze years of financial data with AI — in your browser
Drop a QIF export, bank CSV, or SQLite database. Get 10 analysis views and AI chat. Your data never leaves your machine.
Works with exports from: Quicken · GnuCash · Moneydance · Mint · Any bank
Your financial data deserves better reporting
You've spent years categorizing transactions in Quicken. You've built a complete financial history. But when you try to actually analyze it:
- Year-over-year comparisons limited to 2 periods
- Tag reports broken on split transactions
- No recurring charge detection
- Budget vs actual doesn't exist on Mac
- Dashboard is rigid and useless
- Cash flow visualization? What cash flow visualization?
So you export to Excel. Again. And spend an hour building the same pivot table you built last month.
Ledger Chat reads your exported data and gives you the analysis tools Quicken should have built — in seconds, not hours.
10 views Quicken should have built
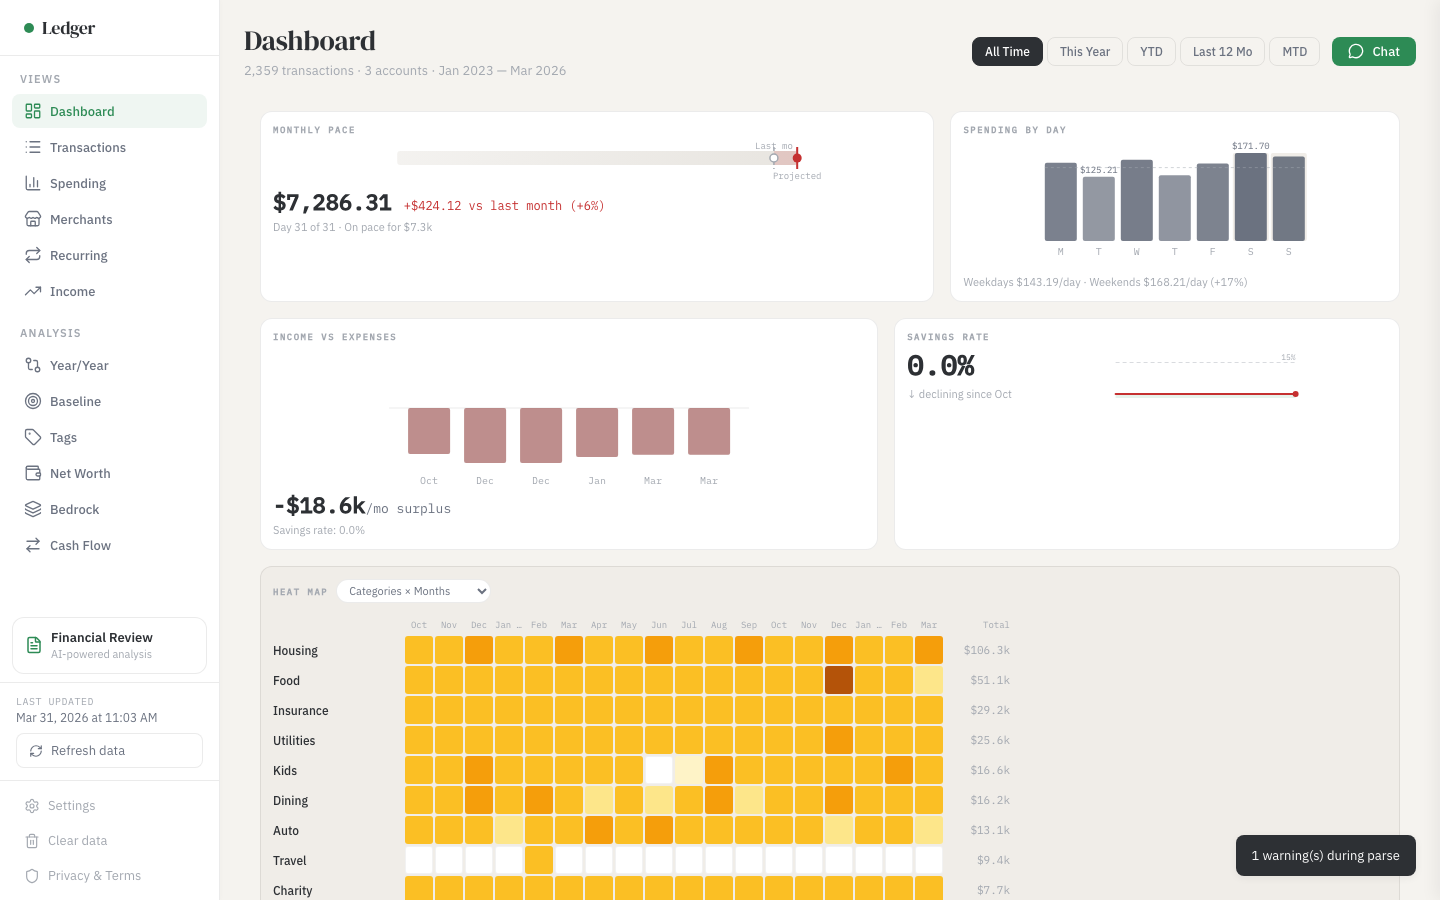
Dashboard — Everything at a glance
Seven KPI widgets with mini visualizations. Click any card to drill into the full view.
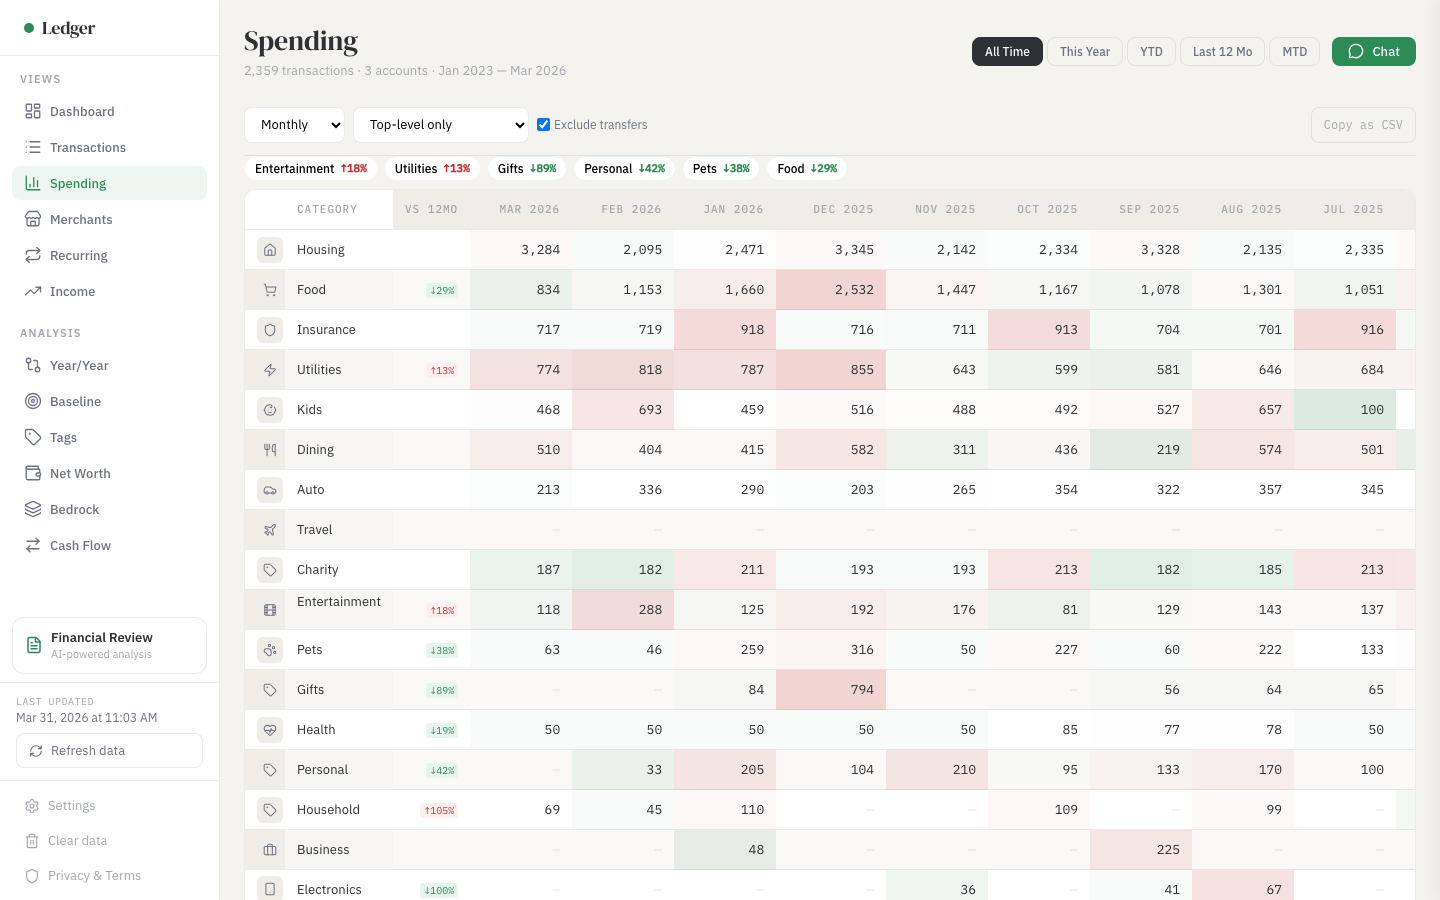
Spending Grid — Compare up to 5 years side by side
Categories as rows, months as columns. Color-coded cells flag deviations from your historical average. Click any cell for the transactions behind it.
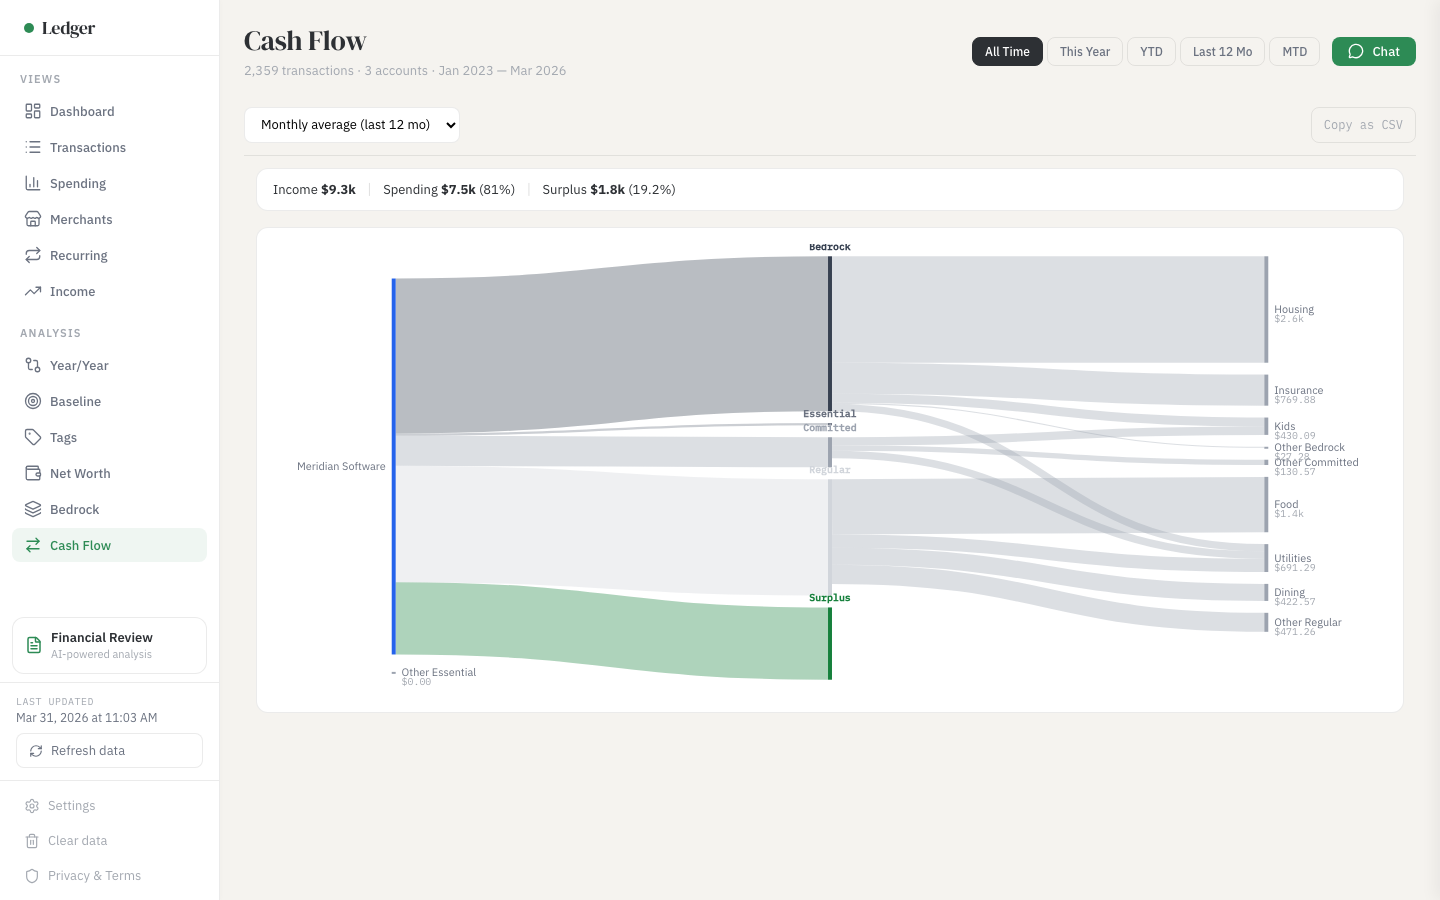
Cash Flow Sankey Diagram — Visualize where your money goes
Income sources on the left, expense categories on the right, flow width proportional to amount. The visualization personal finance enthusiasts share on Reddit.
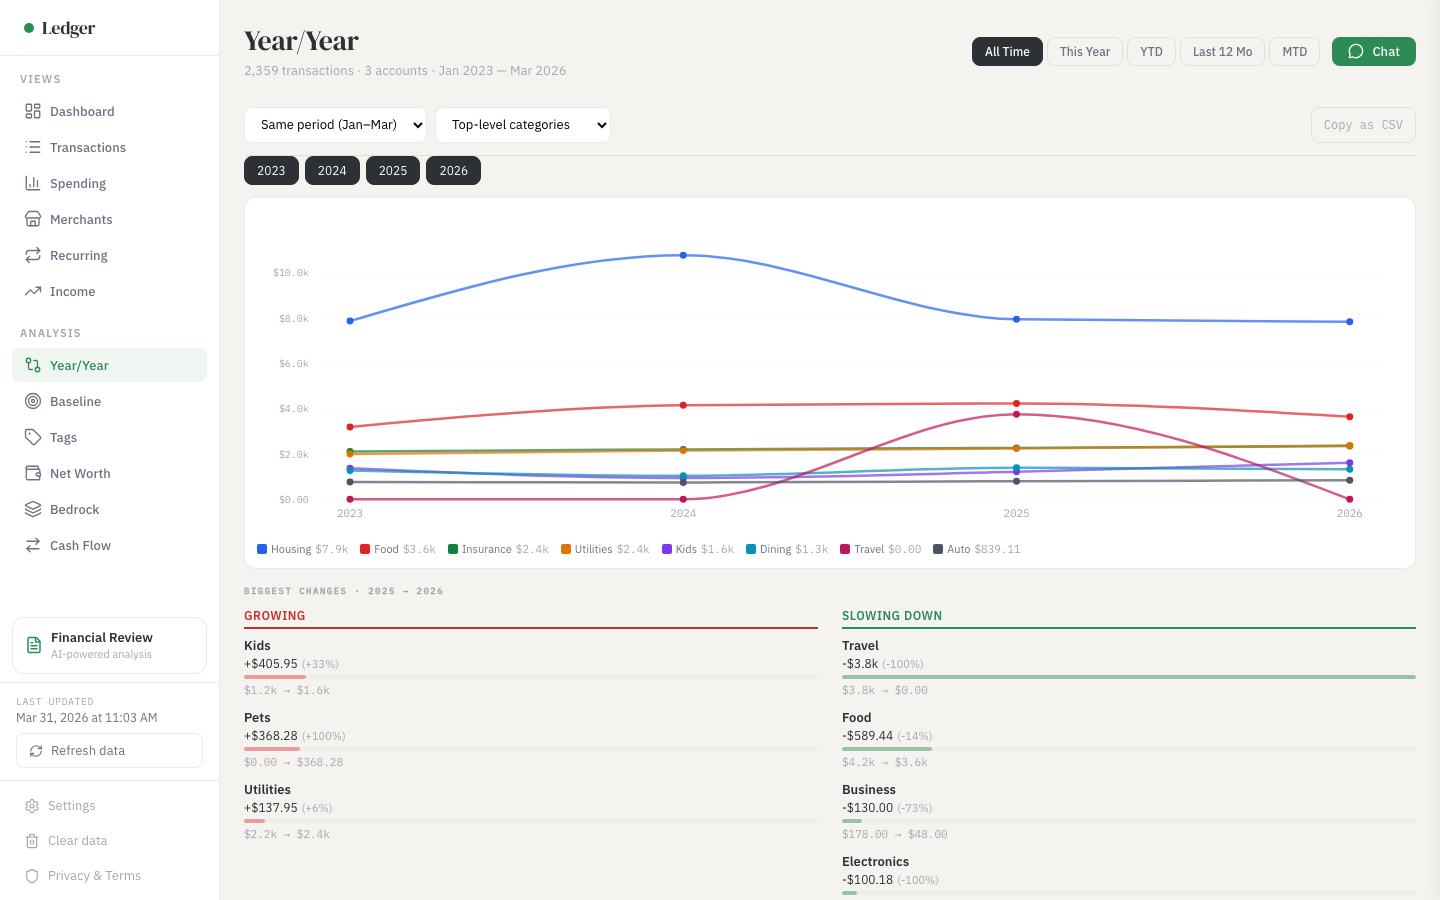
Year over Year Comparison — Track spending trends across years
Same period compared across 3-5 years. Quicken limits you to 2 periods. Bold highlights flag changes exceeding 25%.
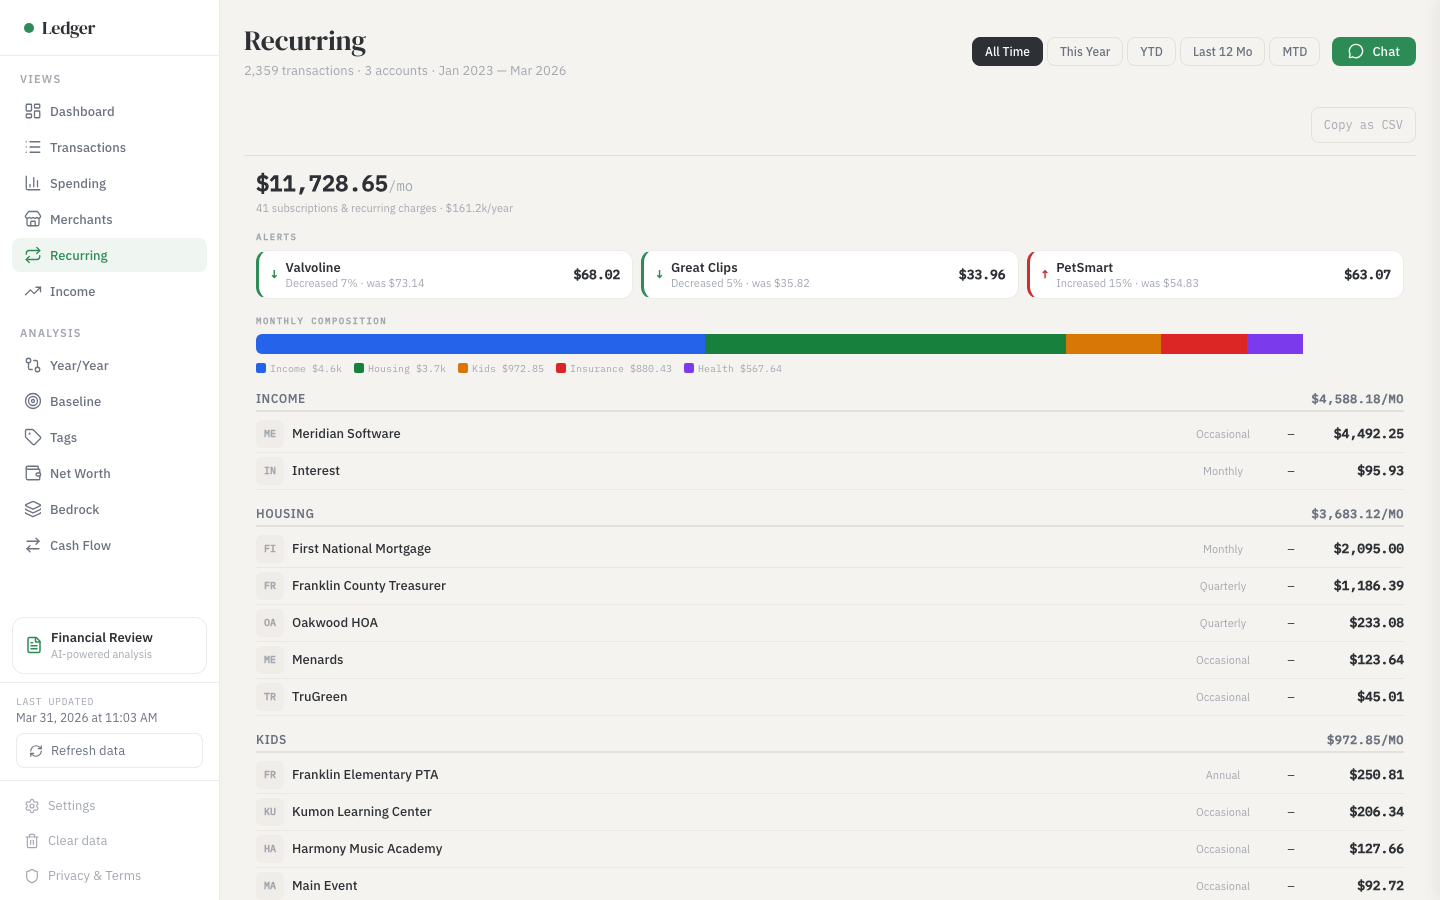
Recurring Charge Detection — Find every subscription automatically
Auto-detected from your transaction patterns. Annual cost projections and price change alerts. The report that replaces a Rocket Money subscription.
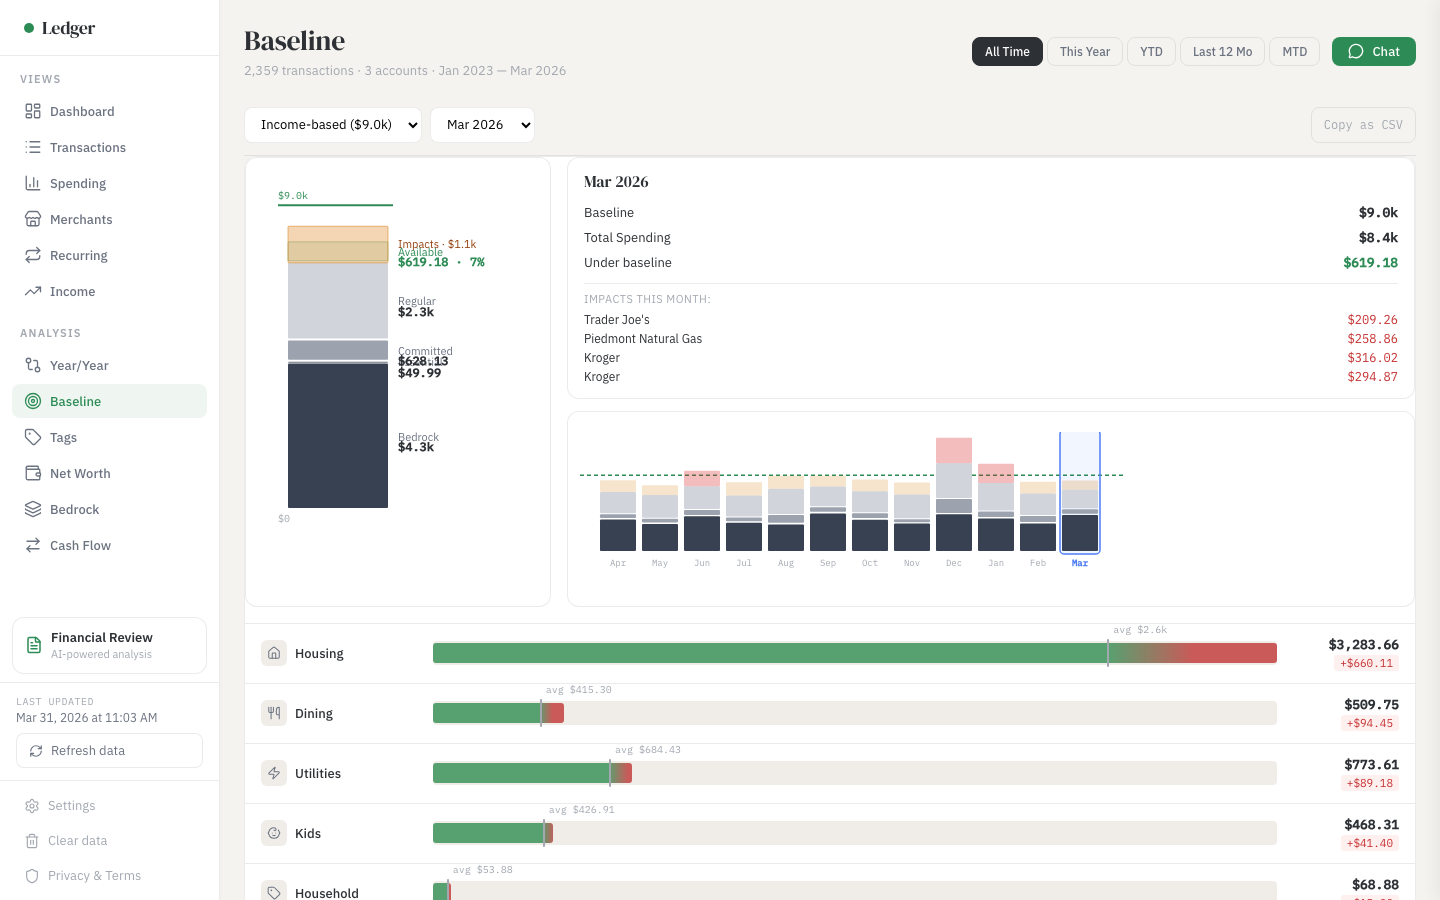
Baseline vs Actual — Compare spending to your own history
Your spending compared against your rolling 12-month average. Uses real data instead of aspirational budget numbers.
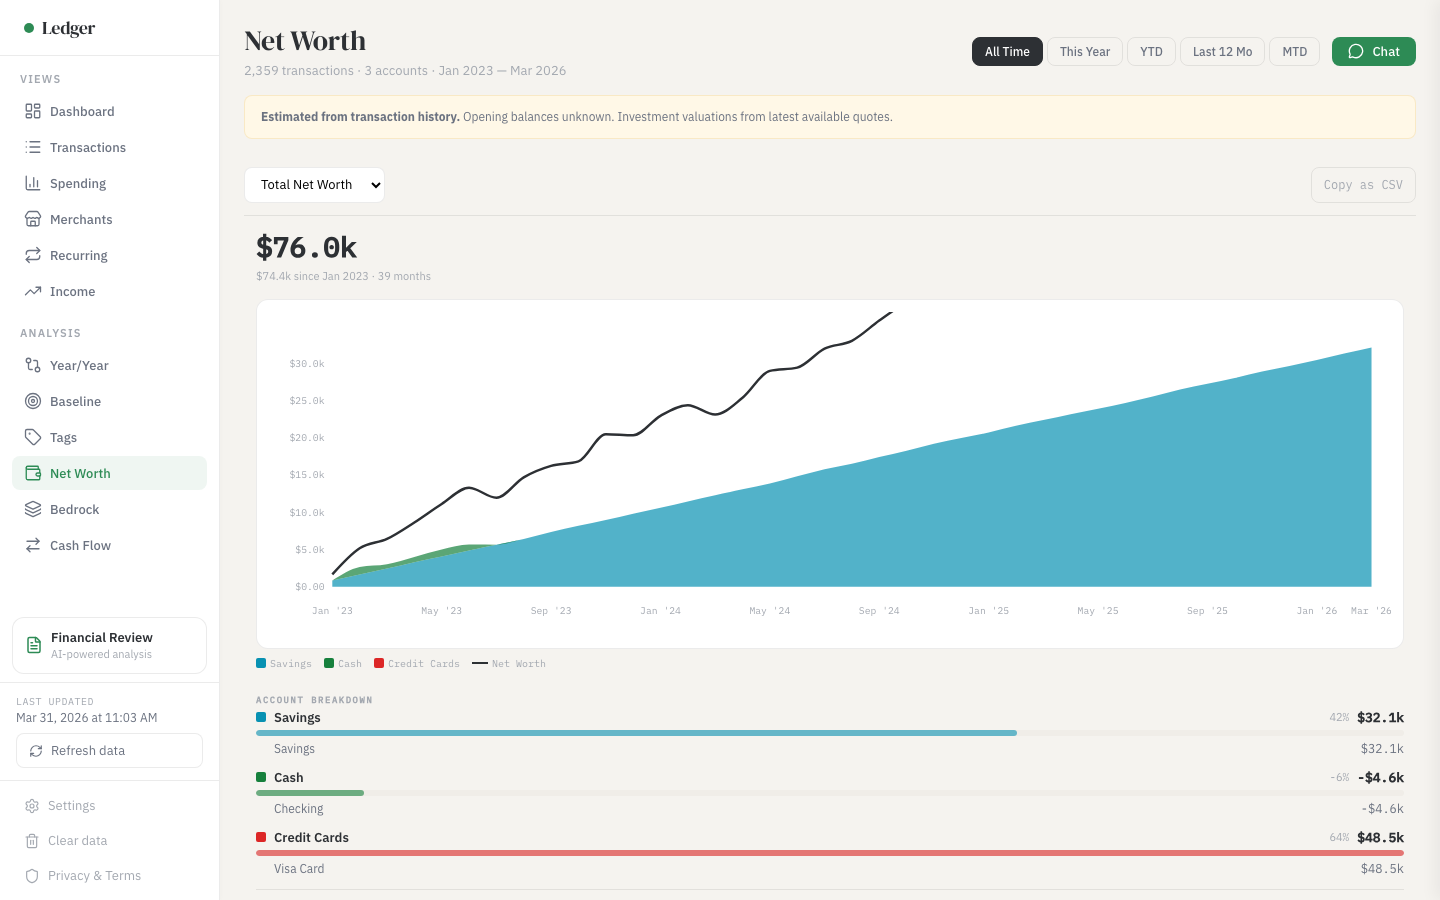
Net Worth Tracking — See your wealth composition over time
Estimated month-end balances from cumulative transactions. Stacked area chart with account grouping and hover breakdown.
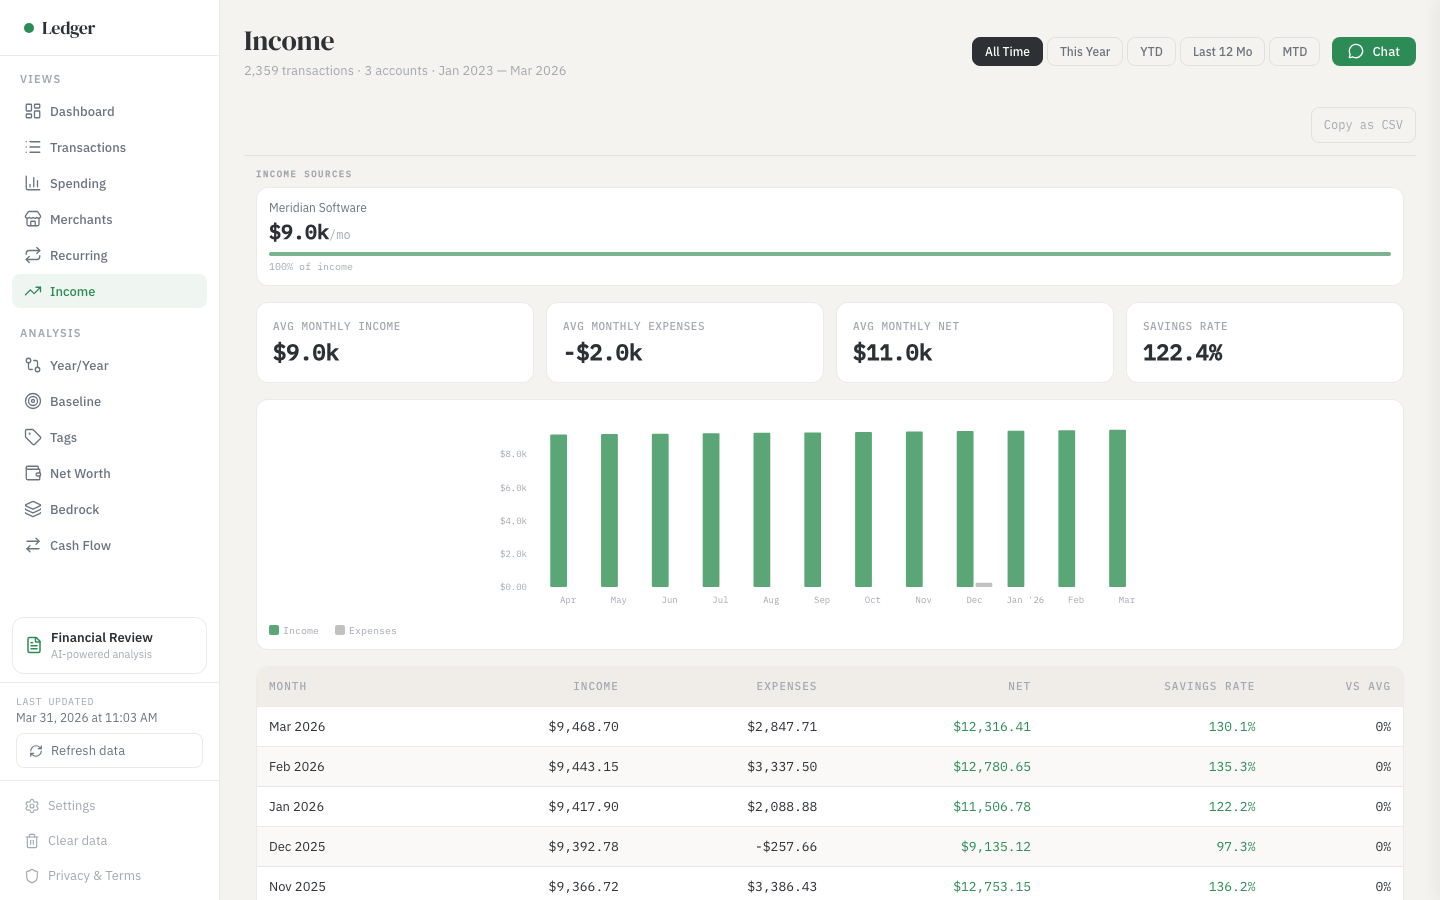
Income vs Expenses — Track your savings rate monthly
Monthly breakdown with income, expenses, net, and savings rate. Red-tinted rows when expenses exceed income.
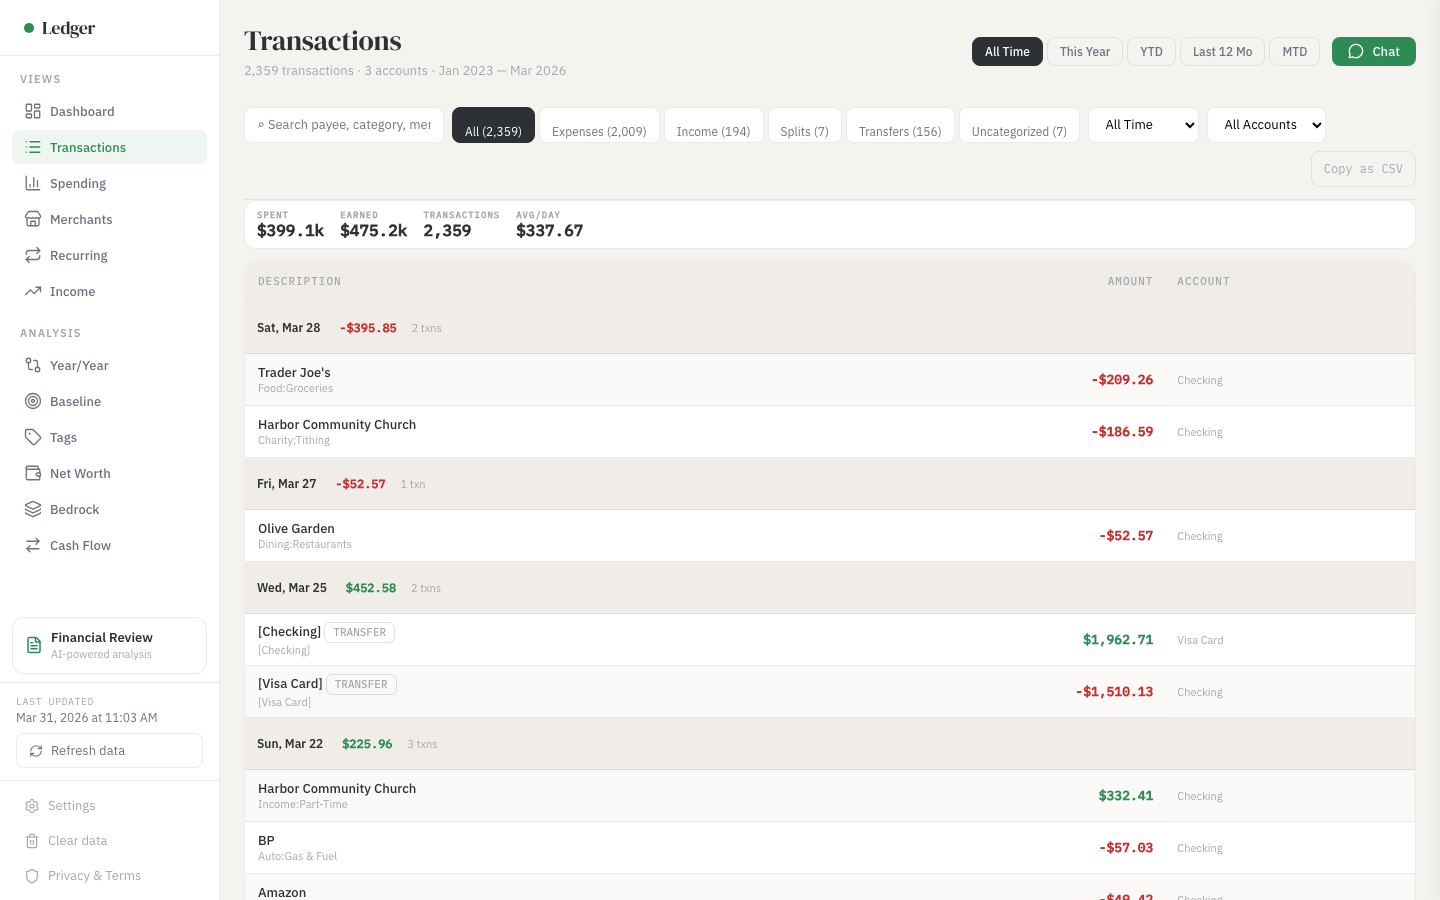
Transaction Browser — Search and filter everything
Full transaction table with search, category filters, date ranges, and sort. Click any row to expand split details, memos, and tags.
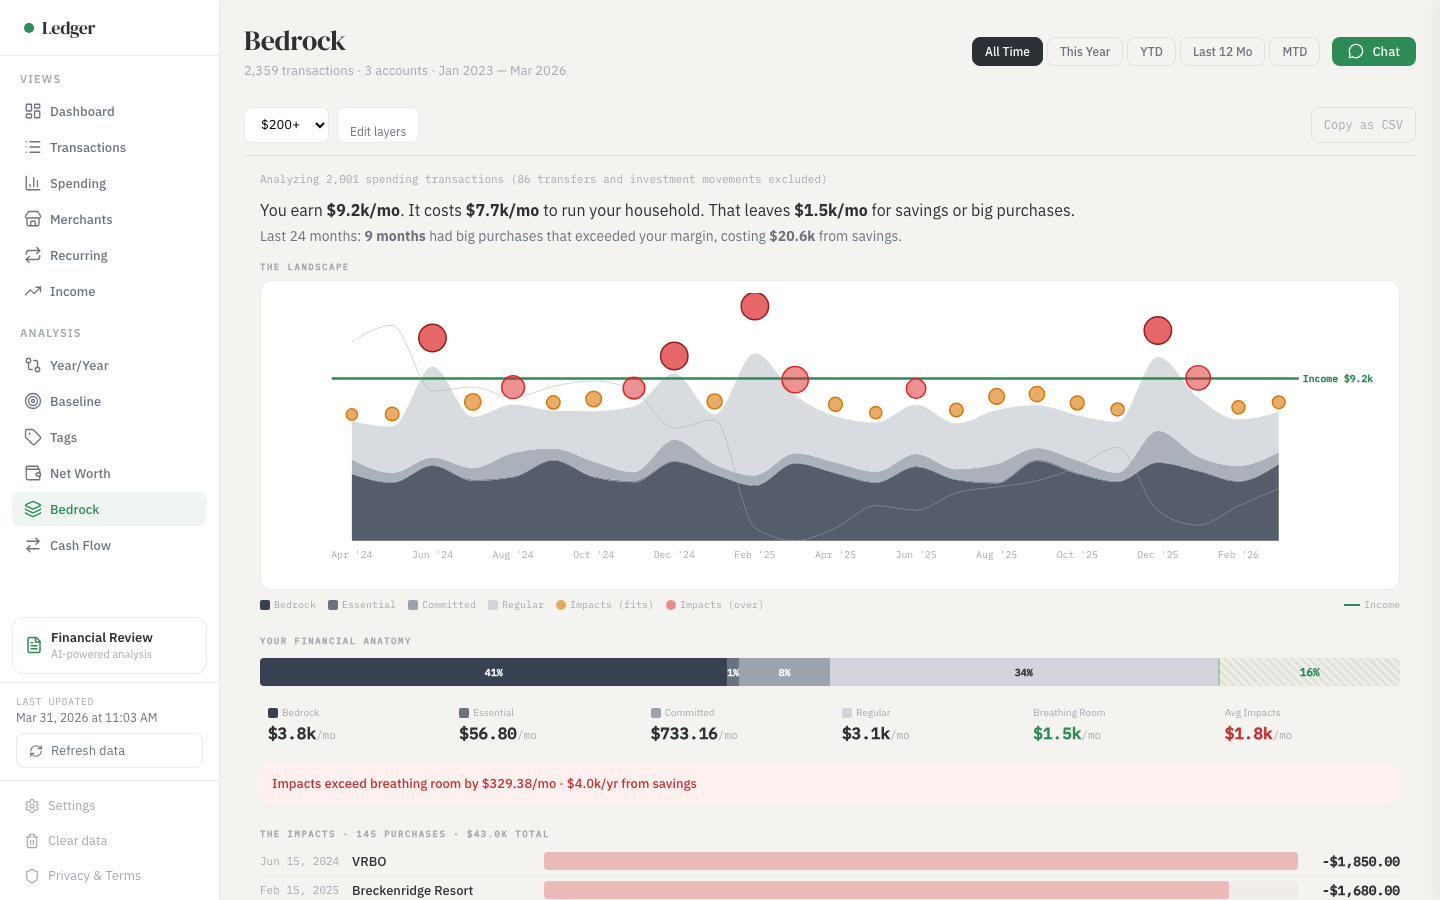
Financial Bedrock — See what it costs you to live
Your spending classified into layers: bedrock fixed costs, essential variable, committed obligations, and discretionary. See your true breathing room.
Ask anything about your money
Powered by your own Anthropic or OpenAI API key. The AI queries your data through 12 specialized tools — it doesn't just guess, it calculates.
The 10 analysis views work without any API key. AI chat is optional.
Three steps. Under a minute.
Export your data
QIF from Quicken, CSV from your bank, or any SQLite database with transactions.
Drop the file
Everything is parsed locally in your browser. Your data never touches a server.
Explore and ask
10 views populate instantly. Chat answers any question about your financial history.
Your data stays on your machine. Period.
Ledger Chat is a static website. There is no backend. No database. No user accounts. Your financial data is parsed in your browser and stored in IndexedDB — a local storage system built into every modern browser.
The only external network calls are:
- Font files from Google Fonts (IBM Plex)
- D3.js and sql.js libraries from CDN
- AI API calls to Anthropic or OpenAI using your API key (only the query context is sent, not your full dataset)
Don't trust us? The entire source code is open.
View source on GitHubWorks with the data you already have
| QIF | Quicken, GnuCash, Moneydance, KMyMoney, HomeBank |
| CSV | Any bank export, Mint data, spreadsheet exports, Tiller |
| QFX/OFX | Bank download files |
| SQLite | Any SQLite database with financial transaction data |
Quicken users: File → Export → QIF. That's it.
Mint users: your old CSV export works as-is.
Bank users: download transactions as CSV.
See what it actually costs you to live
The gap between your layers and your income is your breathing room — the money available for savings and big purchases.
When a big purchase exceeds your breathing room, the visualization shows exactly how it impacts your savings. It's not daily spending that drains savings — it's 6-8 big purchases per year that each felt reasonable in isolation.
Free forever. Open source. MIT licensed.
Ledger Chat is free to use with your own API key. The source code is public on GitHub. You can read every line, verify the privacy claims, contribute improvements, or fork it for your own use.
Built with vanilla HTML, CSS, and JavaScript. No React. No npm. No build step. Ten files. You could read the entire codebase in an afternoon.
If Ledger Chat helped you understand your finances better: